
This page describes all of the UI elements within the InTrace UI.
Press this button to open the connection bar - see below.
Launches a window which allows the entry of class inclusion and exclusion strings. Only classes which match an inclusion strings and don't match any exclusion strings are instrumented.
Press this button to open the settings bar - see below.

Uses the details entered into the Address and Port fields to try and connect to an InTrace Agent. The Status of the connection is given in the Status panel to the right. If the connection succeeds the Connect button will become a Disconnect button.
NOTE: Most of the UI elements in the Client are only enabled when the Client is connected to an InTrace Agent.

This tab controls what trace is produced by instrumented classes and where that trace is sent.
Toggles whether entry/exit trace should be recorded e.g.
[10/06/24 08:40:07]:[1]:example.TraceExample:intArrayMethod: {:70
[10/06/24 08:40:07]:[1]:example.TraceExample:intArrayMethod: }:71
Toggles whether branch trace should be recorded e.g.
[10/06/24 08:41:02]:[1]:example.TraceExample:workMethod: /:43
[10/06/24 08:41:02]:[1]:example.TraceExample:otherMain: /:28
[10/06/24 08:41:07]:[1]:example.TraceExample:exceptionMethod: /:58
[06/26 14:13:31.750]:[1]:example.TraceExample:exceptionMethod: Throw:58: java.lang.Exception: Exception text
	at example.TraceExample.exceptionMethod(TraceExample.java:58)
	at example.TraceExample.workMethod(TraceExample.java:38)
	at example.TraceExample.otherMain(TraceExample.java:30)
	at example.TraceExample.main(TraceExample.java:16)

[06/26 14:13:31.750]:[1]:example.TraceExample:exceptionMethod: Caught:61: java.lang.Exception: Exception text
	at example.TraceExample.exceptionMethod(TraceExample.java:58)
	at example.TraceExample.workMethod(TraceExample.java:38)
	at example.TraceExample.otherMain(TraceExample.java:30)
	at example.TraceExample.main(TraceExample.java:16)

[10/06/24 08:41:07]:[1]:example.TraceExample:workMethod: /:43
Note that currently InTrace treats tracing of throwing and catching exceptions as part of branch trace.
Toggles whether args trace should be recorded e.g.
[10/06/24 08:42:47]:[1]:example.TraceExample:workMethod: Arg: foobar
[10/06/24 08:42:47]:[1]:example.TraceExample:exceptionMethod: Return: seen exception
[10/06/24 08:42:47]:[1]:example.TraceExample:intArrayMethod: Arg: [1, 2, 3]
[10/06/24 08:42:47]:[1]:example.TraceExample:intArrayMethod: Return: 123

Toggles whether trace should be output to trc1.txt/trc2.txt in the current working directory of the instrumented JVM. Each of these files will have 100k lines of trace written to it before the output rolls over to the other file.

Discard trace which doesn't match the local filter patterns.
Discard old trace when we run low on memory.

Toggles whether the InTrace agent should write the source bytecode and generated bytecode for instrumented classes out to files. When enabled, the input byte array is written out to ./genbin/package/path/ClassName_src.class and the modified class bytes are written to ./genbin/package/path/ClassName_gen.class. These files can be used to investigate any cases where InTrace generates invalid instrumentation.
Toggles whether the InTrace agent should output verbose diagnostics to stdout.
Prints out a settings string to the Output text area. For example.
Settings:[out-stdout-true[trace-ee-false[instrujars-false[instru-true[out-file-false[exclude-regex-^$[verbose-false[regex-.*[saveinstru-false[trace-args-false[out-network-false[trace-branch-false
Outputs a list of instrumented classes to the Output text area.
This string can be added to the command line arguments of your program to restore the current settings. For example.
java -javaagent:./traceagent.jar=[out-stdout-true[trace-ee-false[instrujars-false[instru-true[out-file-false[exclude-regex-^$[verbose-false[regex-.*[saveinstru-false[trace-args-false[out-network-false[trace-branch-false my.program.Class
If the InTrace agent which you connect to was started with the argument [startwait then the UI will change to look like the following screenshot when you first connect.

This allows you to setup the classes you want to instrument before the program begins to execute.
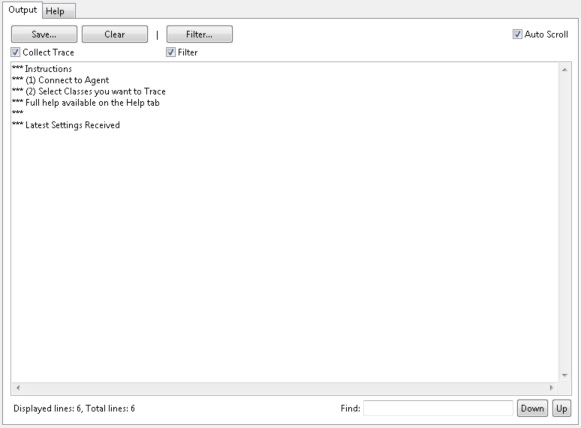
Save the collected Trace output to a file.
Clears all of the text currently held within the Output tab.
Toggles whether trace should be collected over the network.
Launches a dialog which allows text include and exclude filters to be specified. These get applied to all lines of text already collected along with all new lines received from the InTrace agent.
Toggles the configured filter should be applied.
Toggles whether new trace lines should be automatically scrolled into view.
Text within the main text box can be selected and include/exclude filters added from a right click menu. You can jump up/down to method entry/exit with ctrl-up and ctrl-down.
This shows the total number of collected lines of trace along with the number which are currently being displayed.
Enter text and click up/down to search up/down for the entered text.